LOSS RATIOS

AUTO INSURANCE LOSS DATA
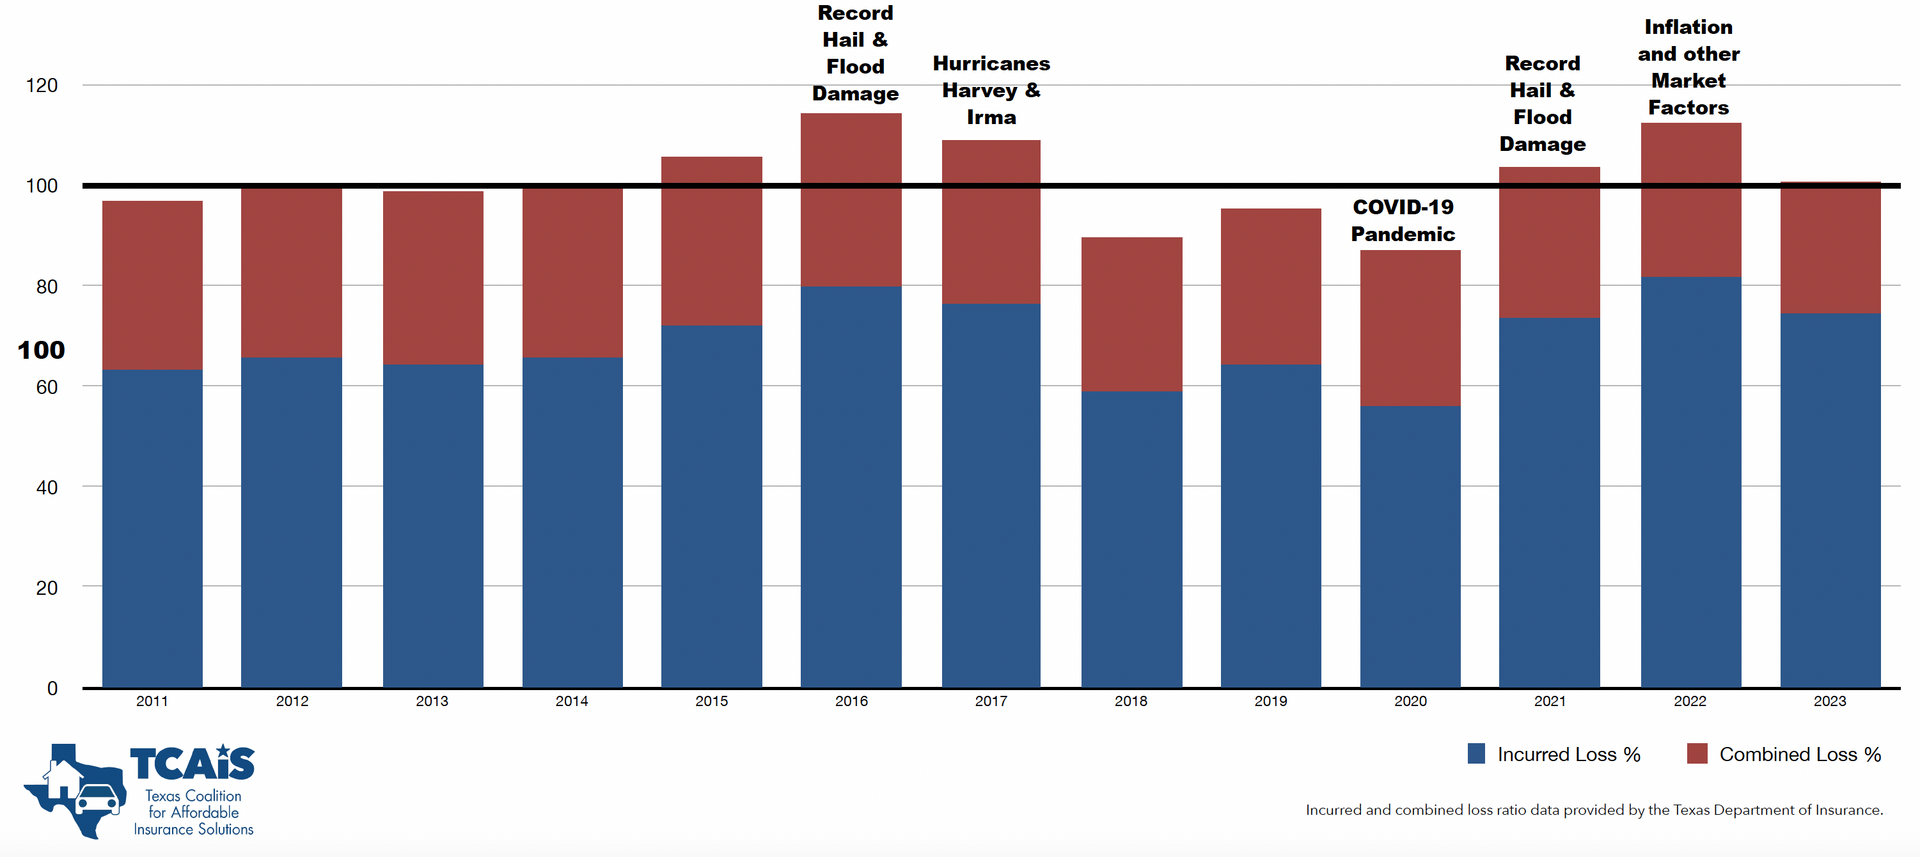
Flooding and hail damage are the largest drivers of auto insurance claims in Texas, where insurance companies operate close to a break-even point in the state’s auto insurance market.
The table below illustrates the effect of these major catastrophic events, including the historic hail storms that pounded the state in 2016 and in 2021 when hail damage was the number one weather-related insurance claim in Texas. The effect of flooding caused by Hurricane Harvey is evident in the 2017 data. While flooded homes are not covered by property and casualty insurance, water-damaged vehicles (by windstorm, flooding, etc.) are covered by auto insurance policies.
The combined loss ratio fell dramatically in 2020 when the COVID-19 pandemic shutdown keep many drivers off the road. Now, however, U.S. auto insurers are coping with the largest direct loss ratio in 20 years because of factors that include historic inflation, increased material and labor costs, supply chain disruptions and deterioration in driving behavior and sky-high jury awards, according to an October 2022 report by the American Property and Casualty Insurance Association.
Data from 2023 and beyond will show the impact of these pressures on auto insurers and insurance affordability. Download chart below here.


